Sold · Dec 2025~$85,000,000Waterfront estate, Rose BayFive-bed harbourfront sold by CPH chief Lawrence Myers - Sydney's biggest reported sale of 2025, weeks before the market peak.
Sydney property values
The market on one technical sheet: median values charted, the news and policy moves behind them, published forecasts - and what it means if you are thinking of selling.
Sheet SYD.01 · Updated 26 September 2026 · Sources: Cotality, Domain, PropTrack, RBA, Treasury, NHSAC - full list below
More locations: Brisbane · Melbourne · Perth · Suburb sheets below
The dashboardCotality HVI July 2026 · RBA · Domain+
Sydney peaked in January 2026 and has fallen every month since - about 5% below peak by early August. Houses ($1.53m, -2.5% yr) are falling faster than units ($890k, -0.6% yr). (Cotality HVI, Jul 2026)
ValuesFig 01+
A decade of Sydney medians
Two booms, two corrections. The 2018-19 credit squeeze, the 2021 COVID boom, the 2022 rate shock, the 2023-25 recovery to records - and now the 2026 correction.
Median price, houses vs units - 2016 to June 2026
Houses
Units
○ = estimated point
View the data as a table
| Year | Houses | Units |
|---|---|---|
| 2016 | $1.12m (est) | $690k (est) |
| 2017 | $1.18m (est) | $740k (est) |
| 2018 | $1,062,619 | $700k (est) |
| 2019 | $1.14m (est) | $735k (est) |
| 2020 | $1.21m (est) | $730k (est) |
| 2021 | $1,601,467 | $802,255 |
| 2022 | $1.42m (est) | $740k (est) |
| 2023 | $1.59m (est) | $770k (est) |
| 2024 | $1.65m | $812,863 |
| 2025 | $1.76m (record) | $844,390 (record) |
| Jun 2026 | $1,733,891 (-3.3% qtr) | $849,068 (-1.5% qtr) |
Domain House Price Reports 2018-2026. Estimated years are anchored to Domain-reported percentage changes.
PulseThe state of play+
A correction, not a crash
July's 1.4% monthly fall was Sydney's largest since December 2022, and clearance rates in the low 50s are a world away from last winter's high 70s. But the drivers are policy-made: three rate hikes and a tax overhaul, colliding with a market that still is not building enough homes.
That mix cuts both ways. Prices are drifting down while borrowing capacity is squeezed - yet rents are setting records, listings remain below the five-year average, and the trophy end keeps printing records. Sellers are not rushing the exits; buyers have more choice and more say on price than at any time in three years.
| Index peak | January 2026 - values now about 5% below peak (Cotality) |
|---|---|
| Monthly / quarterly | -1.4% / -4.0% dwellings (Cotality, Jul 2026) |
| Auction clearance | 58.1% on 631 auctions late Aug - firming from the low 50s into spring, but vs 79.5% a year ago (My Housing Market, 22 Aug 2026) |
| Days on market | Stretched to ~42 (vs ~30 a year ago); about 27% of campaigns have revised their guide down (Cotality, Aug 2026) |
| Listings | Total stock ~+12% on a year ago, but NEW listings ~14% below average into spring - vendors are holding off (Cotality, Aug 2026) |
| Investor lending | Loan lodgements -26% since early Feb; investor loans -5.3% in the Mar qtr (MPA / ABS) |
| Rents | House $850/wk and unit $780/wk - both records; +6.3% / +4.0% in the June qtr (Domain) |
| Yield / vacancy | Gross yield 3.3% · vacancy 1.6% (Cotality) |
| Auction median | $1,800,000 - now down 7.1% year on year, reversing early-August's positive read (My Housing Market, 22 Aug 2026) |
RatesFig 02+
The rate path that turned the market
Three cuts through 2025 lit the January 2026 peak. Three hikes in 2026 - back to 4.35% by May - took the fuel away. The RBA held on 11 August, but the meeting's minutes keep a tightening bias: markets now price roughly a coin-flip chance of one more hike by year-end, while the big banks still see the first cut around mid-2027.
RBA cash rate - May 2022 to August 2026
Cash ratePolicy event (hover)
Policy watchWhat government moved in 2025-26+
P.01Negative gearing + CGT reform - the May 2026 Budget
+
Negative gearing ended for established homes bought after 12 May 2026 (existing holdings grandfathered, eligible new builds exempt), and from 1 July 2027 the 50% CGT discount gives way to cost-base indexation. The effect was immediate: home-loan lodgements fell about 26% from early February and March-quarter investor loans dropped 5.3%. It is the single biggest policy force in the 2026 correction - and it deliberately steers investors toward new builds. (ATO / Treasury, Jun-Jul 2026; MPA, Jul 2026; ABS, May 2026)
P.025% deposit for every first home buyer
+
From October 2025 the First Home Guarantee lost its income caps and place limits, and Sydney's price cap jumped to $1.5 million - so first home buyers can buy with 5% deposit and no lenders mortgage insurance. It is the main reason units and entry-level suburbs are holding up far better than houses in 2026. (Housing Australia, Oct 2025; Cotality, Aug 2026)
P.03Help to Buy shared equity - expanded
+
The federal shared-equity scheme opened in December 2025 and was expanded from 1 July 2026 with 10,000 new places and higher income caps ($103k single / $165k joint); the government co-buys up to 30-40% of the home. Modest but real support at the affordable end. (Housing Australia, Jun-Jul 2026)
P.04The Housing Accord is running behind
+
Australia's 1.2-million-homes target is about 112,000 homes behind pace at the 21-month mark, and the national advisory council projects a miss of between one-in-eight and one-in-five homes. Construction costs are ~47% above pre-COVID. Undersupply is the floor under prices - and the engine under rents. (NHSAC State of the Housing System 2026; Cotality Cordell, Jul 2026)
P.05NSW planning reforms are working - slowly
+
Transport Oriented Development rezonings, the low-and-mid-rise housing policy and the Housing Delivery Authority - the biggest rezoning program in the country - have NSW approvals up 13.5% year on year and moving ~30% faster. The June 2026 NSW Budget added foreign-surcharge relief for large build-to-rent and retirement projects. More homes near stations is the medium-term supply story. (NSW Government, 2026; Property Council, Jun 2026)
P.06Foreign buyer ban extended · APRA buffer unchanged
+
The ban on foreign purchases of established homes was extended to 30 June 2029 in the May Budget, and APRA left the 3-percentage-point serviceability buffer untouched despite lobbying - so borrowing capacity stays tight even as listings grow. (ATO, 2026; APRA via Australian Broker, 2026)
OutlookFig 03 · Published forecasts + our read+
Where the forecasters land
Nobody sees a boom. The spread runs from ANZ's -9.9% to CBA's flat-to-plus-two, with Domain's FY27 call of -7% to -3% for houses in the middle - and units expected to outperform houses on every desk.
Published 12-month Sydney forecasts
Houses / dwellings
Units
◆ = point forecast
Our read · 01
Next 12 months: lower, and the hike raises the risk
With a September hike to 4.60% ~93% priced and falls now covering 93% of capital suburbs, the consensus band of Sydney houses between -7% and flat holds - but the risks have shifted to the lower half, with the top end correcting hardest and affordable corridors most resilient. (Basis: Cotality Sep 2026; Domain, ANZ, Westpac, CBA - Jun-Sep 2026)
Our read · 02
Rents: more records ahead
Investors are exiting, vacancy is 1.6%, and the Accord is a year of homes behind. Expect asking rents to keep setting records into 2027 - the correction is in prices, not in housing demand. (Basis: Domain Rent Report Jul 2026; NHSAC 2026; ABS May 2026)
Our read · 03
The turn: watch mid-2027
Big-4 consensus has the first rate cut around mid-2027, and ANZ pencils recovery from late 2027 - at which point the supply shortfall starts working for prices again. Sellers with flexibility are planning around that window. (Basis: RBA Aug 2026; bank forecasts Jun-Aug 2026)
Recent salesReported results · sources cited+
What is actually trading
Real results as reported in the press - from a $527,000 Ashfield one-bedder to an $85 million Rose Bay waterfront. Every card carries its source.
Sold · Feb 2026$50,000,0003 Kirkoswald Avenue, MosmanSix-bed Susan Rothwell estate on 2,235 sqm above Balmoral - the record sale north of the Harbour Bridge, confirmed at settlement.
Sold · Jul 2025$21,000,000"Keba", Wharf Road, Birchgrove1878 sandstone waterfront sold over the fence to the neighbour - the inner west peninsula record.
Sold · Aug 2026$4,480,88814 Rickard Street, CarlingfordThe top reported Sydney auction sale of the 22 August weekend, on a firming 58% clearance Saturday.
Sold · Aug 2026$3,900,0004 Hamilton Street, RiverviewFour-bed house - the top reported Sydney auction result of the 8 August weekend.
Sold · Aug 2026$3,530,000524 Crown Street, Surry HillsAmong the week's strongest reported auction results in the inner city.
Sold · May 2026$3,275,00025 St Albans Street, AbbotsfordThree-bed family home with pool near Henry Lawson Park, sold at auction.
Sold · Aug 2026$3,200,0003 Grace Avenue, CabramattaA $3.2m result in the south-west - the affordable corridors' rise, priced.
Sold · Aug 2026$2,910,00059A Prospect Street, ErskinevilleAmong the top reported sales of the 8 August auction weekend.
Sold · May 2026$2,620,0002 Hackett Road, AbbotsburySix-bed family home, sold prior to auction.
Sold · Aug 2026$2,600,00033 Waratah Parade, NarraweenaReported among the beaches' strongest results of the week.
Sold · Aug 2026$2,200,00049 Burraneer Bay Road, BurraneerSold under the hammer on a 36%-clearance Shire Saturday - the right price still clears.
Sold · Aug 2026$527,0002/18 Chandos Street, AshfieldOne-bed unit - the week's most affordable reported Sydney auction sale.
Sales as reported by the cited publications. agent.casa was not involved in these transactions, and listing photography is not reproduced.
On the marketThe headline listings · photographed+
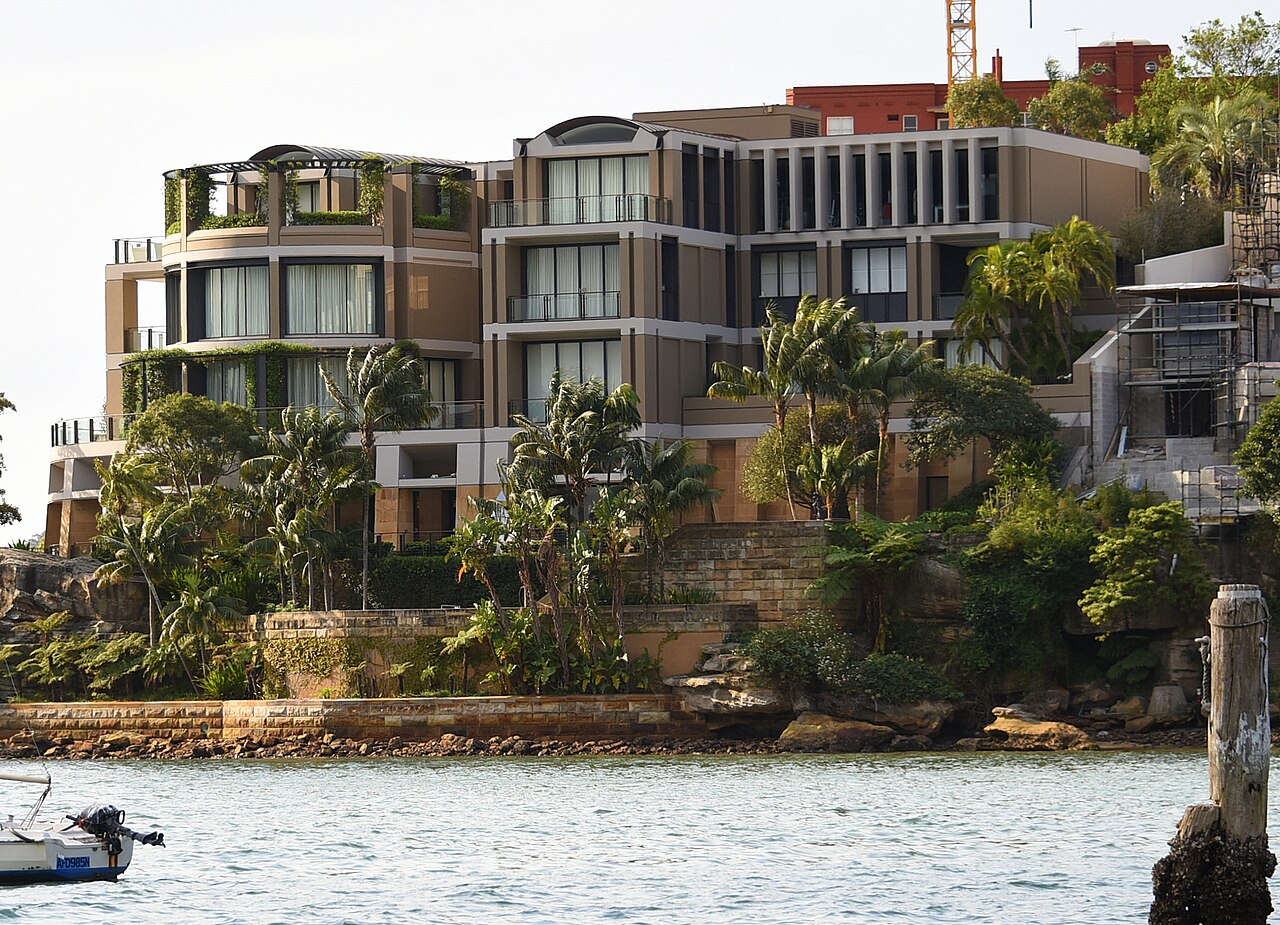 Listed
$200,000,000+"Wingadal", Wolseley Road, Point PiperJohn Symond's harbourfront estate, with offers above $200 million reportedly rejected - a sale would rewrite the national record.Photo: Sardaka · CC BY-SA 4.0 · Wikimedia Commons
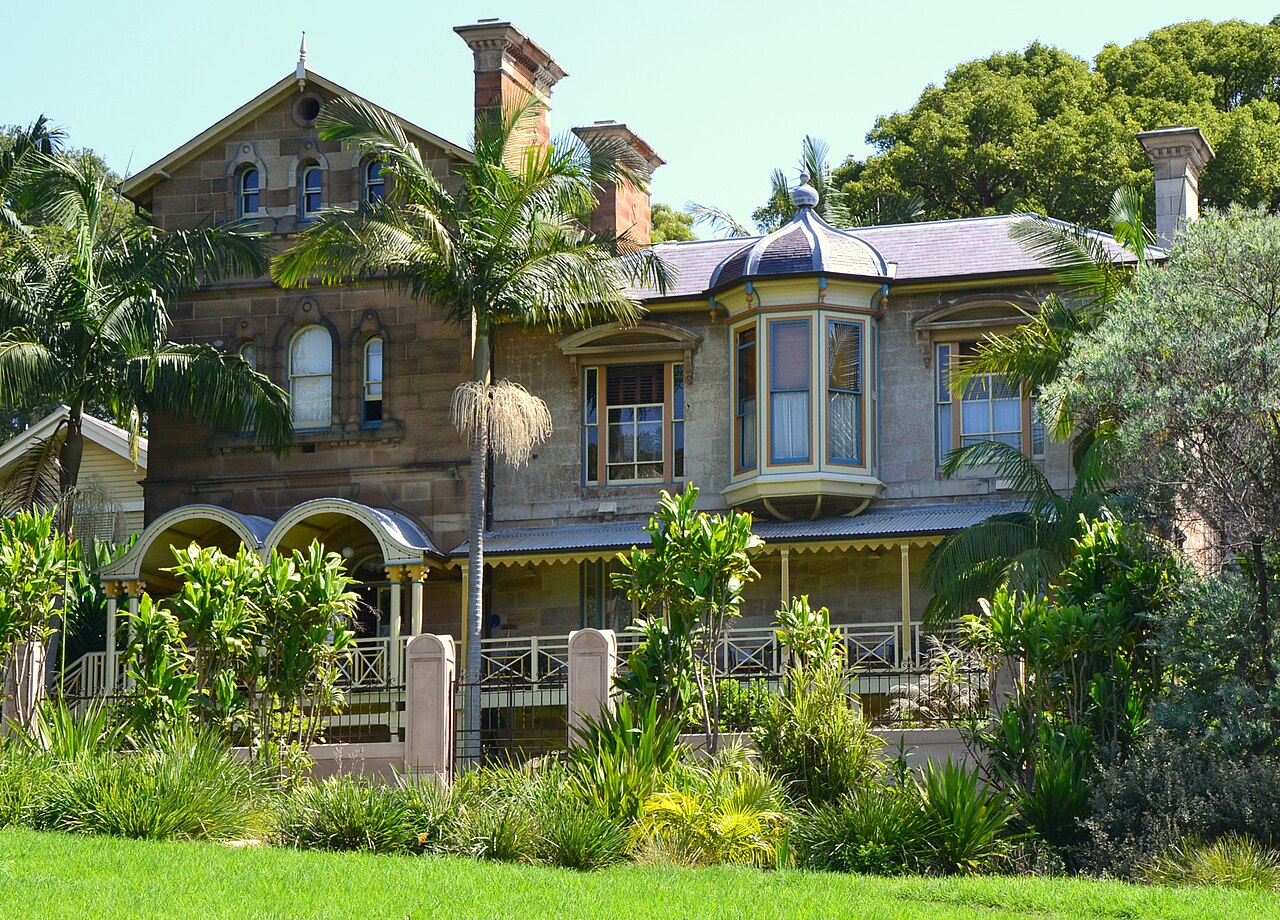 Listed
$27,500,000 guide"Ewenton", Blake Street, BalmainThe inner west's grandest estate, on the market since late 2025 and still seeking its buyer - the prestige market's caution, measured.Photo: Sardaka · CC BY 3.0 · Wikimedia Commons
Photographs show the actual properties and are openly licensed via Wikimedia Commons, credited above. Listing details as reported by the cited publications; agent.casa is not the listing agent.
Suburb sheetsPopular Sydney suburbs · trailing 12 months+
Suburb by suburb
The city median hides a two-speed market: beach and terrace suburbs still printing gains, prestige pockets slipping, and the affordable west doing the heavy lifting. Click any suburb to request appraisals there.
| Suburb | Segment | Median | 12 mo |
|---|---|---|---|
| Bondi Beach | House | $4,630,000 | +7.6% |
| Manly | House | $6,875,000 | +16.6% |
| Mosman | House | $5,090,000 | -2.7% |
| Paddington | House | $3,890,000 | +8.6% |
| Surry Hills | House | $2,300,000 | +10.2% |
| Newtown | House | $1,970,000 | +5.4% |
| Marrickville | House | $2,237,500 | +3.4% |
| Chatswood | House | $3,290,000 | +4.7% |
| Parramatta | Unit | $636,000 | ~0% |
| Cronulla | House | $3,210,000 | +10.0% |
| Randwick | House | $3,800,000 | +5.7% |
| Castle Hill | House | $2,470,000 | +3.1% |
Where the growth went
The affordable west leads the year to June: Penrith +9.8% ($1,092,427), Richmond-Windsor +9.2%, Campbelltown +9.2%, St Marys +9.0% - first-home demand on the 5% deposit scheme at work. (Cotality SA3, Jun 2026)
Where it is coming off
The top end is leading the correction: Sydney's upper-quartile values fell 3.2% in the three months to July, and prestige pockets like Vaucluse houses (-3.3%) have gone negative for the year. (Cotality, Aug 2026)
Reading suburb medians
Suburb medians move on what sold, not just on values - a few trophy or renovator sales can swing a quarter. Treat single-suburb changes as a guide, and get a local appraisal before you act. Parramatta is shown as units - its market is unit-dominated.
Suburb figures: OpenAgent suburb profiles (Cotality-derived sales data), accessed August 2026. Medians vary by provider and methodology. More suburbs are added as data is compiled.
In the newsWhat is driving commentary+
N.01RBA · PropTrack · Aug 2026
Rates back at 4.35% crushed borrowing power
Three 2026 hikes fully unwound the 2025 cuts - and Sydney, the most price-to-income-stretched market, now leads national falls on every major index.
N.02MPA · ABS · Jul 2026
The Budget tax shock hit investors first
Loan lodgements fell about 26% after the negative-gearing and CGT overhaul; the new-build exemption is designed to push investors into new supply instead.
N.03Cotality · Domain · Aug 2026
The downturn is broadening
July's national fall was the largest since December 2022, with Brisbane, Adelaide and the regions joining Sydney and Melbourne; auction withdrawals are at record highs.
N.04NHSAC · Cotality Cordell · 2026
Supply is still the crisis underneath
The Housing Accord is ~112,000 homes behind pace, construction costs are ~47% above pre-COVID, and the industry is short roughly 141,000 workers.
N.05Domain · Jul 2026
Rents are re-accelerating to records
House rents $850/wk and units $780/wk - the sharpest quarterly rises in about four years - as investors exit and vacancy sits near 1.6%.
N.06Housing Australia · Cotality · Jun 2026
A two-speed market has emerged
First home buyers on the 5%-deposit scheme are cushioning units and affordable corridors (Blue Mountains +13.0%, Merrylands-Guildford +12.5% for the year), while mid-prestige softens and only best-in-class trophy homes set records.
N.07My Housing Market · Domain · 21 Sep 2026
The cooler spring arrived on schedule
Sydney clearance slid to 54.0% by the 20-21 September weekend (57.8% the week before; 78% a year ago) even as auction volumes lifted to 796 - buyers are waiting out the rate decision while vendors chase a spring window that keeps softening.
N.08Cotality HVI · PropTrack · Sep 2026
The downturn is now near-universal - led from the top
93% of capital-city suburbs recorded falls through winter (45.8% in autumn). Sydney dropped another 1.4% in August to a $1.223m median dwelling value, ~7.1% below the February peak - with upper-quartile houses off more than 10% while affordable segments hold best. PropTrack has Sydney -4.9% from peak and -3.6% for the year.
N.09RBA · major-bank forecasts · Sep 2026
A September hike is ~93% priced
Markets and all four major banks expect the RBA to lift the cash rate to 4.60% on 29 September, with ANZ pencilling 4.85% by year end - July inflation eased to 3.5% headline but trimmed mean is stuck at 3.6%. A fourth 2026 hike would take borrowing power to its tightest since 2011.
Sources+
- 01Cotality (formerly CoreLogic) - Home Value Index July 2026 (rel. 3 Aug 2026); Monthly Housing Chart Pack (Jul 2026); Cordell Construction Cost Index
- 02Domain - House Price Report June qtr 2026; Rent Report June qtr 2026; Price Forecast report (Jun 2026); historical December-quarter reports 2018-2025; auction results
- 03PropTrack (REA Group) - Home Price Index July 2026
- 04Reserve Bank of Australia - monetary policy decisions and Board minutes to late Aug 2026
- 05Treasury / ATO - Tax Reform No. 1 Act 2026 (negative gearing + CGT); foreign buyer measures
- 06Housing Australia - First Home Guarantee (Oct 2025); Help to Buy (Jun-Jul 2026)
- 07NHSAC - State of the Housing System 2026 · NSW Government planning releases 2026
- 08Bank + analyst research as published: ANZ (Aug 2026), Westpac (Jul 2026), CBA, NAB, SQM Research (Apr 2026 revision)
- 09Press and results services: AFR via Bloomberg (Dec 2025), Domain News and auction results (2025-26), Neighbourhood Media (Feb 2026), Allhomes, My Housing Market / Dr Andrew Wilson weekly auction reports (Aug 2026), APM data via Harwood Property Agents (Aug 2026), The Nightly, Forbes Australia, Property Update, MPA, ABS Lending Indicators
- 10Photography: openly licensed images of the pictured properties by Sardaka via Wikimedia Commons (CC BY 3.0 / CC BY-SA 4.0), credited beneath each photograph
This page is general information compiled from the published sources listed - not financial, investment or property advice, and not a valuation of any property. Figures are point-in-time (September 2026), medians and indexes differ by methodology, and forecasts are the named forecasters' own. Get advice for your circumstances before acting.
What is YOUR home worth? Get an in-depth AI valuation report for your exact property - value range, recently reported sales, drivers and improvement ideas - $2.95 AUD per report. AI estimate only - not a formal valuation or advice.
Domain medians are stratified; Cotality values are hedonic index values - the two are not interchangeable, so each chart and figure names its source. Estimated series points are marked. This sheet is refreshed when new monthly data lands.
Selling into this market?
In a correction, the spread between a great agent and an average one is the whole result. Compare who is actually beating the market in your suburb - then get free appraisals.